Thursday, August 22, 2019

Suicidal Children in the Western Pacific

Which children are suicidal in the Western Pacific?

Why is this question important? According to a 2014 article, suicide rates in the Pacific Islands are some of the highest in the world. In countries like Samoa, Guam, and Micronesia, suicide rates are double the global average with youth rates even higher. 

I decided to look at the World Health Organization's Global School Based Health Survey taken in the Western Pacific countries, most of them in the 2010s (China's was taken in 2003). The purpose in looking at those surveys is to see if I can predict whether a child would be suicidal or not.

There is a question in the survey that asks if a child has seriously considered attempting suicide in the past 12 months in the survey. In most surveys, there are two related questions which I did not keep as my features (they would highly bias what I am trying to predict). But, I used all the other survey questions to see if I could classify whether a child has seriously considered attempting suicide or not.

In addition to the survey, I gathered information about the country itself, such as GDP and population. I combined my data tables using some SQL. 

(I used Tableau to create all of the charts I will be showing.)


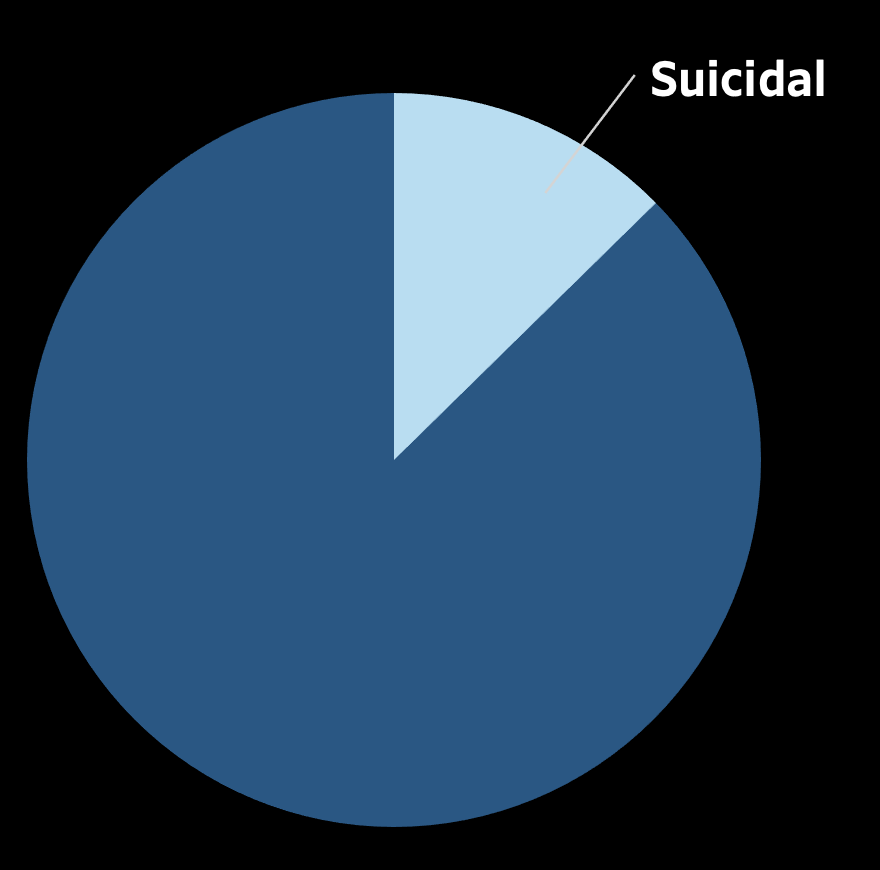
According to the survey data, about 13% of children are suicidal in the surveyed Western Pacific countries.

This imbalance caused me to change my class-weights in my logistic regression model. It was a 5:1 class weight situation, where the suicidal class weighed 5 times as much as the non-suicidal class.

I used an F1 metric, weighing both precision and recall equally to evaluate my model. I received an F1 score of .42 on a hold out set using logistic regression.

I later decided to use XGBoost to potentially improve my F1 score. I did not use class weights, but did decrease the threshold for my positive class to .19 and received an F1 score of .44. 

Actually, recall is slightly higher when using logistic regression than XGBoost. I should have chosen logistic regression as my main model, or should have used an F-beta metric to weigh recall more (since it is better to catch all of the suicidal kids even though some may not really be suicidal than to not catch all of the at-risk kids). But, I chose XGBoost as my main model and looked at the feature importance. 

I found some very interesting correlations. One top feature in both my XGBoost model and one that gave a lot of signal in my logistic regression model is the loneliness factor and insomnia factor. 


Suicidal Children are 3x as Likely to Have Experienced Extreme or Moderate Loneliness


Suicidal Children are 3x as Likely to Have Lost Sleep over Excessive Worrying


Suicidal Children are 3x as Likely to Have Been Bullied


Suicidal Children are More Likely to Have Tried Cigarettes and at a Younger Age


Where are these suicidal children located?

It turns out the top three countries with the highest percentage of suicidal children (according to the survey) is in islands. 


Is it a coincidence that Samoa is in the top 3 high risk countries? I'm not too surprised, since there is an article that mentions Samoa having very high youth suicide rates. 

But, why the islands?

The article mentions that lack of economic opportunity among the youth may be the cause, but the data also paints a slightly different angle of the phenomena.

So, the takeaways:

Top conditions that are related to children to become suicidal are loneliness, bullying, worrying and insomnia and perhaps cigarette use.

Other considerations may be the child's gender and the perception on how much their parents understand their problems. Also, population and a country's colonial history shows up as important features somehow.

At the end of the day, it is hard to predict whether a child is suicidal or not from just health survey data, but it does show some interesting trends.

Sunday, August 4, 2019

Go-Fund-Me

Introduction

Some of you know about GoFundMe, which is a free online fundraising platform.

With crowdfunding, people can harness social media to fund for anything from
medical expenses to honeymoon trips.

If you were a potential user of GoFundMe, it would be nice to know about how
much of your goal you would successfully be able to raise. If you know
beforehand your success rate, you will have an idea of whether or not GoFundMe
is the right place for you to raise money. I predict that what you are fundraising
for, your goal amount, and what your story is will be able to give some idea
of what percent of your goal you will be able to fundraise.

To see how predictive the category of your campaign, the goal amount and the
story is in the amount you will be able to fundraise, I decided to create a linear
regression model with those features.

Web Scraping


I did web scraping using beautiful soup and selenium to develop my database.
I then did some preprocessing, which included changing the format of my data to
extract the numbers that will be used in future analysis. Then, I did data analysis
which included locating and removing outliers and plotting residual plots. Looking
at residual plots pointed me to do some feature engineering where I used
polynomial features and one hot encoding on categories of campaigns. Lastly, I
fit models to my data by doing train-test-split and cross validation to decide which
model gave the most predictive power.


I scraped the location, story, date, category, money raised, goal, and social media
shares. Only the money raised, goal, story, and category ended up being used as
my raw features because the nature of the problem means that I start at time 0 and
have 0 social media shares. Location was removed from my features because most
of the campaigns were in the United States and I didn’t feel it was as important.
With the story, I engineered three features- word count, polarity score, and
subjectivity score. 


Data Analysis


After preprocessing the data, I was able to create some charts. I see that the
distribution of my target, the percent of goal fundraised, is left skewed. It shows that
many people do reach their fundraising goal.


The next step is to locate and remove outliers. Looking at the amount of goal, we
see that most people’s goal is to fundraise $500,000 or less. I will remove the data
points that have a goal greater than $500,000. Looking at the word count, we see
that most people have stories that are 1500 words or less, so I will remove data points
that have a word count greater than 1500.


Looking at the residual plot where I compared the features of goal amount, word
count, polarity score and subjectivity score, I see that I am either over-predicting or
under-predicting my percent of goal raised all the time. Maybe this means that using
polynomial features might help.

Modeling


Linear regression on 941 observations and using polynomial transformations of goal

amount, word count, polarity score, and subjectivity score, I received an R^2 score of .20.

Linear regression on the one-hot-encoding of categories gave me an R^2 score of -.03.


Combining the one-hot-encoding of categories and the polynomial transformations of

the four features above, I received an R^2 score of .42, which is not entirely bad
considering that I am trying to predict human behavior.

Using cross validation, I was able to see that lasso regularization gave me the 
highest R^2 score. 

Interpretation


Looking at the coefficients, I was able to see what the percent boost or reduction of
your goal by category was. The values assume that you are holding everything else
constant. 


Campaigns that get on average the highest reduction in their percent of goal
include newlywed, business, and competition categories. Campaigns that get on
average the highest boost in their percent of goal include medical, emergency, and
memorial categories.


It turns out that in addition to animals, community, creative, and event having coefficients
of 0. Polarity score, subjectivity score and their polarity score times subjectivity score also
has a coefficient of 0 under lasso regularization.  This makes sense, from our previous
F-statistic analysis, which shows that polarity might not have anything to do with percent
of goal raised.

Further Tuning of Model

One glaring error in my model is that it assumes that campaigns are completed by the
time I scraped the data. That is not true, so adding the time component into my model
will greatly fine tune my model. The question of how much one might be able to
fundraise is also a bit flawed. A better question would be how much one would expect to
be able to fundraise in a given time.

I can group my data into different bins according to a "days active" feature and do
further analysis with that. I suspect a similar trend in the categories that get a percent
boost or percent reduction in their goal will remain, but the newer model may have more
accurate predictions.