Showing posts with label tableau. Show all posts

Monday, November 25, 2019

Forest Fires in Brazil

Context

As a person who cares about environmental issues, coming across a data set about forest fires in Brazil on Kaggle was very exciting. The data set contains the number of forest fires in 23 states in each month over the span of years from 1998 to 2017 reported by the Brazilian government. I decided to analyze the data set to find the trend of the number of forest fires, to find when forest fires occur with the highest frequency, and to create a Tableau dashboard to visualize the change in the number of forest fires over time.

engine = 'python'

When reading the csv file with the data set, I had to set the engine parameter to python because UTF-8 couldn't decode some characters.
I realized that the month names were in Portuguese, so I decided to change all the month names to numeric names. I created a new column in my dataframe that are the numeric equivalents to the month names.

Geocoding

 I wanted to have the latitude and longitude for each state in the data set so that I can graph it in the future. So, I used locationiq's API to find the latitude and longitude for each state.

I then was able to create a dictionary of the states and their respective latitude and longitude values. I was able to use two apply functions to apply to each row the correct latitude and longitude based on the state.

Average Number of Forest Fires Per Year in Each State

The visual I wanted to create is one of a map which shows the average number of forest fires per year in each state in the data set with a circle. The larger and darker the circle, the higher the average number of forest fires per year. I would need to create a dataframe with the average number of forest fires per year in each state first. Here is the code, which required use of a groupby:


Total Number of Forest Fires Per Year

It would be great if I could see the overall trend of forest fires throughout the years. I decided to use another groupby to find the sum of all forest fires over the years. I found that there was an increasing trend.

A dashboard where the user could click on a point on the line graph which corresponds to a specific year and the number of forest fires would filter the map of Brazil to the corresponding year and show the average number of forest fires in each state would be pretty nice. So, I did that.

Monthly Trends in Forest Fires

Before I show the Tableau dashboard, I would like to show a graph which represents the monthly trend of forest fires over the years. As you can see, the graph below shows that the number of forest fires are low in the beginning of the year, increases quickly in June, peaks at July, drops a bit in September, then spikes again in October.


Looking at a bit more granular of a level, you can see the shift in the lines upward since 1998 of the number of forest fires over months. This supports the positive trend seen in the number of forest fires over the years.


An Increasing Trend of Forest Fires in Brazil

Lastly, I would like to present the Tableau dashboard I created with a short video. You can see the change in the sizes and shade of the circles that represents the average number of forest fires in each state over time. The trend line of the total number of forest fires each year is also there. Sao Paulo always has a very large average number of forest fires each year.


Thursday, August 22, 2019

Suicidal Children in the Western Pacific

Which children are suicidal in the Western Pacific?

Why is this question important? According to a 2014 article, suicide rates in the Pacific Islands are some of the highest in the world. In countries like Samoa, Guam, and Micronesia, suicide rates are double the global average with youth rates even higher. 

I decided to look at the World Health Organization's Global School Based Health Survey taken in the Western Pacific countries, most of them in the 2010s (China's was taken in 2003). The purpose in looking at those surveys is to see if I can predict whether a child would be suicidal or not.

There is a question in the survey that asks if a child has seriously considered attempting suicide in the past 12 months in the survey. In most surveys, there are two related questions which I did not keep as my features (they would highly bias what I am trying to predict). But, I used all the other survey questions to see if I could classify whether a child has seriously considered attempting suicide or not.

In addition to the survey, I gathered information about the country itself, such as GDP and population. I combined my data tables using some SQL. 

(I used Tableau to create all of the charts I will be showing.)


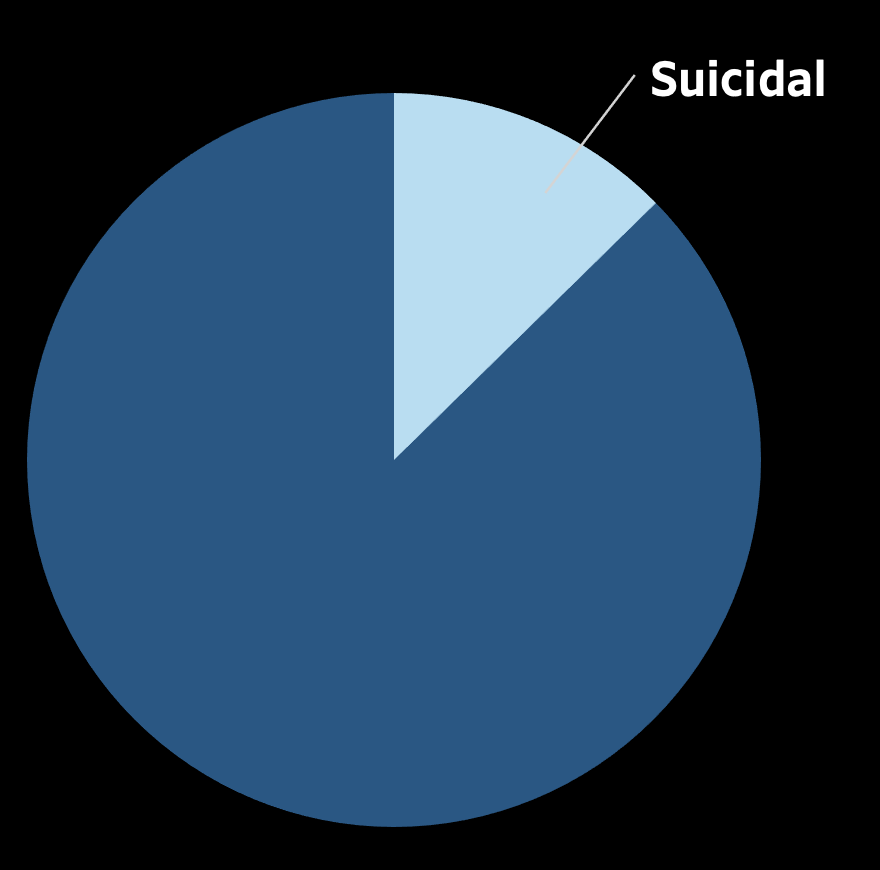
According to the survey data, about 13% of children are suicidal in the surveyed Western Pacific countries.

This imbalance caused me to change my class-weights in my logistic regression model. It was a 5:1 class weight situation, where the suicidal class weighed 5 times as much as the non-suicidal class.

I used an F1 metric, weighing both precision and recall equally to evaluate my model. I received an F1 score of .42 on a hold out set using logistic regression.

I later decided to use XGBoost to potentially improve my F1 score. I did not use class weights, but did decrease the threshold for my positive class to .19 and received an F1 score of .44. 

Actually, recall is slightly higher when using logistic regression than XGBoost. I should have chosen logistic regression as my main model, or should have used an F-beta metric to weigh recall more (since it is better to catch all of the suicidal kids even though some may not really be suicidal than to not catch all of the at-risk kids). But, I chose XGBoost as my main model and looked at the feature importance. 

I found some very interesting correlations. One top feature in both my XGBoost model and one that gave a lot of signal in my logistic regression model is the loneliness factor and insomnia factor. 


Suicidal Children are 3x as Likely to Have Experienced Extreme or Moderate Loneliness


Suicidal Children are 3x as Likely to Have Lost Sleep over Excessive Worrying


Suicidal Children are 3x as Likely to Have Been Bullied


Suicidal Children are More Likely to Have Tried Cigarettes and at a Younger Age


Where are these suicidal children located?

It turns out the top three countries with the highest percentage of suicidal children (according to the survey) is in islands. 


Is it a coincidence that Samoa is in the top 3 high risk countries? I'm not too surprised, since there is an article that mentions Samoa having very high youth suicide rates. 

But, why the islands?

The article mentions that lack of economic opportunity among the youth may be the cause, but the data also paints a slightly different angle of the phenomena.

So, the takeaways:

Top conditions that are related to children to become suicidal are loneliness, bullying, worrying and insomnia and perhaps cigarette use.

Other considerations may be the child's gender and the perception on how much their parents understand their problems. Also, population and a country's colonial history shows up as important features somehow.

At the end of the day, it is hard to predict whether a child is suicidal or not from just health survey data, but it does show some interesting trends.